
Ethereum Corrects to $2,300 After Strong Recovery, Bullish Signals Remain Clear

After hitting a weekly high of $2,693, Ethereum (ETH) corrected to $2,378, representing a decline of about 5% in the past 24 hours. Despite the correction, ETH is still up more than 35% over the past month, reflecting a strong revival in the cryptocurrency market in general and Ethereum in particular.
Surge in Trading Volume – A Sign of Renewed Interest
Market data shows that ETH’s 24-hour trading volume has increased by 128.6% to $29.6 billion, indicating new money flowing into Ethereum from both retail and institutional investors. The picture from the derivatives market also reinforces this trend: according to CoinGlass, ETH futures trading volume increased by 135%, while open interest decreased by 5.53%, implying that short-term traders are closing positions, leaving room for a potential long-term accumulation.
Technical view: Short-term negative, medium-term positive
Technical analysis shows that Ethereum is trading back inside the Bollinger Bands after a short-term sell-off. The RSI (relative strength index) is currently at 59.6, indicating that bullish momentum has cooled off from overbought territory, but remains in a strong neutral zone.
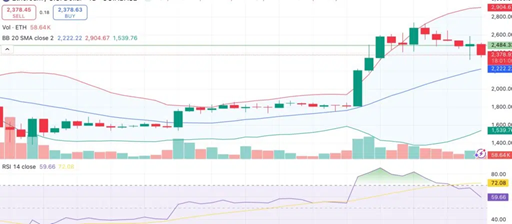
Indicators such as the 10-day EMA and short-term SMA are flashing red, reflecting short-term bearish momentum. However, ETH remains above the 20-, 30-, and 50-day moving averages, suggesting that the medium-term uptrend has not been broken. Additionally, the MACD remains in positive territory, reinforcing the possibility of a recovery if ETH finds solid support.
Expert Analysis: Cautious but Optimistic
Analysts remain divided on the short-term outlook, but remain broadly bullish.
The Titan of Crypto, in a May 17 post on the X platform, said that Ethereum “still has fuel left in the tank.” He cited the weekly Stochastic RSI indicator, which has not yet reached overbought levels – suggesting the rally could last for a few more weeks.
On the other hand, Crypto Patel sees the current decline as a healthy correction after a hot run. He points to a strong resistance zone at $2,500, which is considered a “fair value gap” (FVG) – a price area where ETH has moved rapidly, often leaving behind unfilled orders.
Patel predicts ETH could fall to the $1,930-$2,100 region, in line with another FVG and a bullish order block near $1,810. This is where institutions or whales typically place large buy orders, and could therefore act as strong support for the price. If this area holds, he believes the next high could take ETH closer to the $4,000-$5,000 region.
Bottom Line: Ethereum Remains Positive in the Medium Term
Despite a short-term correction, Ethereum still maintains positive technicals on the larger timeframe. Strong trading volumes, a return of institutional money, and emerging strategic support zones are all signs that ETH’s rally is not over yet.
With expectations of an Ethereum spot ETF, upcoming network updates, and the continued growth of the DeFi & L2 ecosystem, Ethereum could be gearing up for a new bullish wave in the near term – if the market maintains positive sentiment and the current support zone is not breached.